 Older video tutorials on features, homework, handouts, practice, and more!
Introduction
Welcome to FluidMath!
FluidMath provides a fluid user interface to mathematics. It brings computations and interactive visualizations to your math writing surface.
FluidMath's features currently include:
- recognition of handwritten math
- fluid user interface
- computer algebra system (CAS)
- graphing
- sliders
The tutorial. This tutorial will get you up and running quickly through a series of basic lessons. It should take about 5-10 minutes.
Live practice area. Note to the right of the tutorial is a "live", interactive FluidMath region in which you can try out concepts presented in this tutorial.
Pen modes. Note that the pen can be in one of a number of modes, controlled by the toolbar at the top of the page. By default, for new users, it is in Draw mode, which does not interpret ink. This tutorial defaults to Math mode, which does interpret ink, but you will have to switch the mode of the pen in the main page to Math mode to replicate these examples.
Which devices? FluidMath is designed for use on iPads, Interactive Whiteboards, and Tablet PC's. It may also work on other devices. If it doesn't work on your device, please contact us and let us know.
Approximating and simplifying
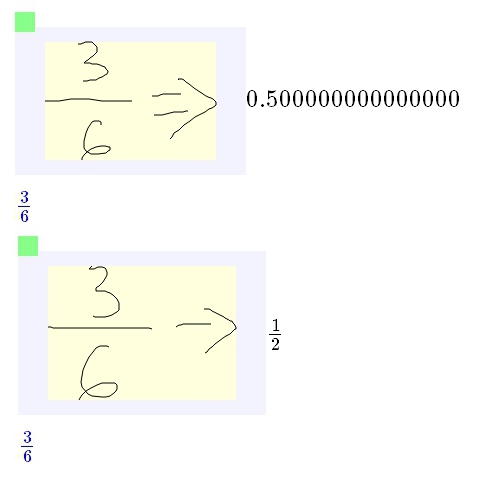
FluidMath provides computation and computer algebra system (CAS) support.
In general, to numerically approximate an expression, write a "double arrow" to the right of the expression.
To simplify an expression, write a "single arrow" to the right of the expression.
See the image to the right for examples.
Try it! Try writing a few expressions and numerically approximating and simplifying them now.
Practice: What is the numeric approximation of ? What does simplify to?
Solving
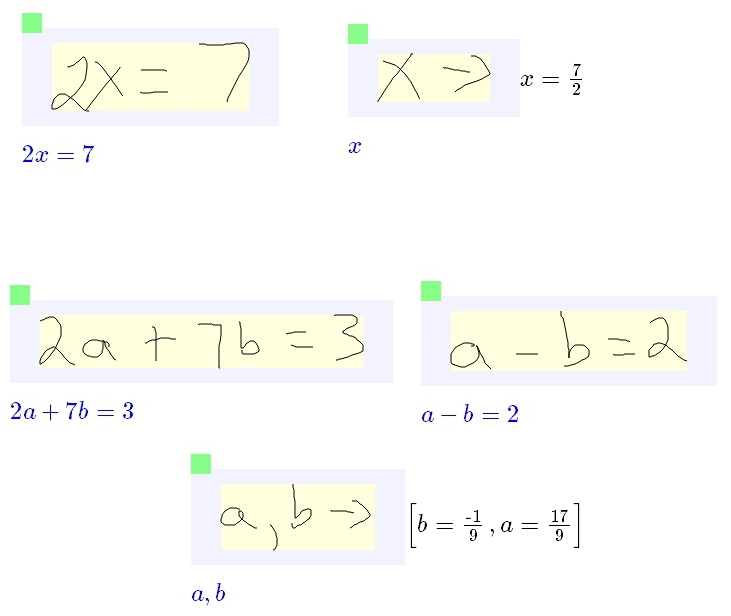
FluidMath can solve for one or more variables.
To solve for a variable, first write some math that uses the variable and then write a new expression consisting only of the variable you want to solve for. Next write a single-arrow or double-arrow to the right of the variable and the solution will be shown.
In the example to the right, 'x' is being solved for on the top and 'a' and 'b' are being solved for on the bottom.
Try it! Try writing a few math expressions and solving for one or more variables now.
Scribble erase
The "Clear" button is useful but it erases everything on the screen. Sometimes you just want to edit a few strokes.
FluidMath provides a "scribble-erase gesture" that can erase just a few strokes. A gesture is a stroke that is interpreted as a command rather than a stroke that is left on the page.
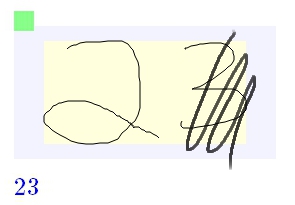
To erase a stroke, scribble over it. In this example, the scribble and the "3" symbol will disappear leaving just the "2" symbol.
Let's try it! First click "Clear" to erase the page. Then write the number "23". Next, draw a "scribble-like" stroke back and forth several times over the "3", as shown in the image to the right. The "3" should disappear.
Be sure to touch the ink of the stroke you want to erase. Also, be sure to go back-and-forth several times (3-4 times) or the stroke may be interpreted as math rather than an erase gesture.
Tip: If the scribble stroke and the target strokes do not disappear and the scribble mark is added to the page, then just try again. Draw another scribble stroke in the same place but try adding more "back-and-forths" and/or sharper turns as illustrated in the figure to the left.
Practice: Now practice writing some multi-symbol math expressions and then scribbling out one or more symbols. For example, try writing "y = x + 2" and then change the math expression to "y = x - 4".
Writing your first symbol
This lesson will teach you how to write a single symbol.
The right half of this page is a "live" FluidMath page. In it, write the number "2".
In general, when you finish writing a math stroke several things happen. First, strokes close to each other will be grouped into a single math expression. Each math expression will have a yellow box drawn around it.

The expected result from drawing a "2". The yellow box contains the expression's strokes. The blue typeset indicates the system's recognition of the strokes. And the green box is a drag handle for moving the expression.
Also, when you stop writing, a green progress bar is shown below the math expression. When it completes, the recognition result will appear in blue typeset below your writing. As you use FluidMath more, you will just glance at the blue typeset as you work to verify your strokes were recognized correctly, or to know there is a problem that needs correcting.
Notice too the green square at the top-left of each yellow-box. You can move a math expression by clicking and dragging the green square.
Returning to our goal of writing and recognizing a "2", if the recognition is wrong press the "Clear" link (at the top-right of the page) and try again.
Practice: Once you get a "2" recognized, please try writing a few more individual symbols — maybe a "3", "8", and "y". At first write one symbol at a time and push the "Clear" link after each is recognized.
Next try writing multiple symbols on the same page. Notice if you write symbols near each other that they are grouped into a single math expression (visually indicated by a yellow box that contains neighboring symbols) and if you write symbols far apart there will be multiple yellow boxes, each containing the strokes of separate expressions.
Examples of basic symbols
For your reference, below are demonstrations of the allographs supported in FluidMath for each of the basic symbols. Strokes have been exaggerated to show when one, two, or three strokes were used.
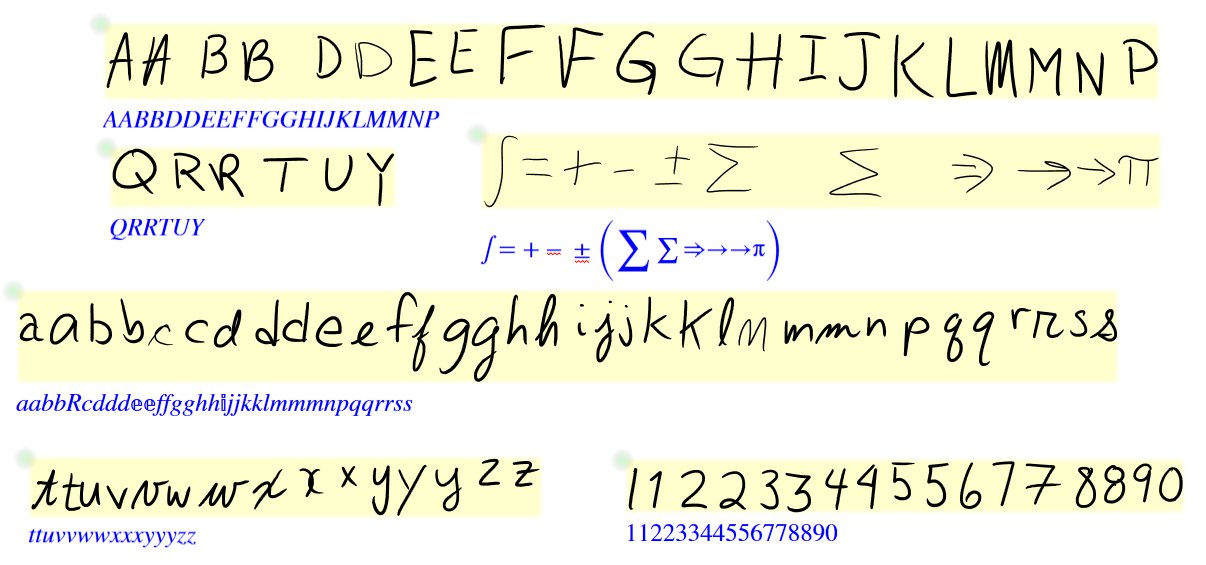
FluidMath will recognize additional math symbols as well, but the most common ones are shown here.
If FluidMath has trouble recognizing a symbol in your handwriting, consider writing the symbol in the style shown here. If you continue to have recognition problems, please contact us.
Writing a math expression
You now know the techniques needed to write and edit math expressions:
- writing math symbols
- reviewing a recognition (the blue typeset math)
- editing
Practice: Try writing some increasingly complex math expressions. First try writing some numbers or simple assignments like "a=12". Then move on to simple and complicated expressions like fractions, exponents, square roots, etc.
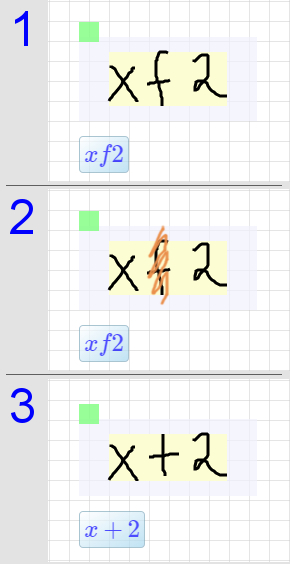
1) A "plus" symbol was recognized as an "f". 2) To correct the problem, scribble erase the misrecognized strokes and rewrite them. 3) The plus symbol is recognized correctly.
Editing expressions. At times, you will want to modify an expression. This is a powerful feature of FluidMath because all calculations and graphs on the page will update in response to the change. You can perform the modification by simply scribbling out the symbols you want to change and then writing new symbols.
Correcting a misrecognition. Sometimes, FluidMath will not recognize a part of an expression correctly. As an example, see the top image to the right. Although the handwritten strokes look somewhat like a "plus", it was recognized instead as a "f".
If this happens, you do not need to erase the whole expression. Instead, first find the incorrect symbol in the blue typeset and then locate the strokes associated with that symbol. Scribble erase those strokes as shown in the middle image, and then rewrite the symbol as shown in the bottom image.
Graphing
Graphing is easy with FluidMath!
To graph an expression, first write the expression, and then draw the graphing gesture. Plot a point by writing a coordinate pair and then graphing it.
The sequence of images below demonstrate the process. (To zoom in on the illustration, click it and then click 'back' to return to this page.)
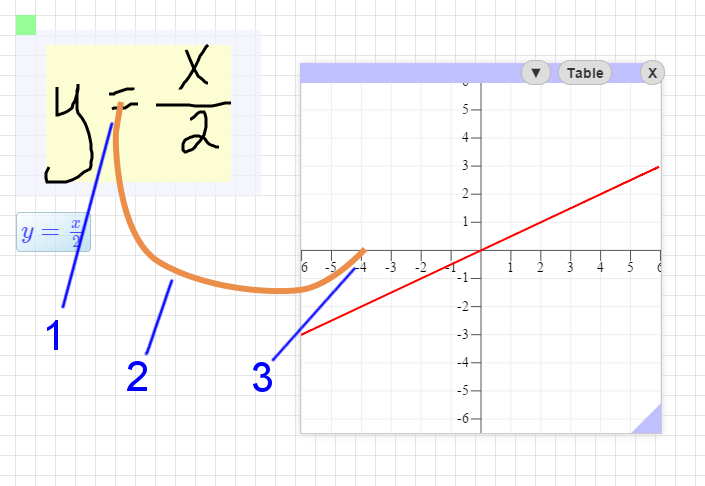
1) Start graph gesture inside yellow box near equal sign. 2) Graph gesture should have looping-curve to it, as shown. 3) End graph gesture on existing graph or empty part of page to create a new graph.
The graphing gesture is a stroke that starts inside the yellow bounding box and ends on an empty part of the page. See for example the orange stroke in the second image from the top to the right.
The graphing gesture is a stroke that starts inside an expression's yellow bounding box, has a looping shape like a "U", and ends on an empty part of the page.
FluidMath can graph inequality equations such as y > x or y ≤ 2x + 3.
Try it! Try graphing the expression "y = x + 1".
NOTE: If you draw a graphing gesture and do not get a graph, then scribble erase the stroke left on the page and try drawing the graphing gesture again. If you continue to not get a graph, try starting your graphing gesture on top of the equal sign.
Interacting with Graphs. Graphs can be interactively manipulated.
- To pan the graph, click on the background and drag.
- To zoom in or out on the graph, click and drag from the origin
of the graph to scale the x and y axes.
- If you are using a wheel mouse, you can roll the wheel to zoom in or out relative to the cursor position.
- iPad users can use the two-finger pinch-zoom gesture to zoom in or out of a graph.
- Move the graph by clicking and dragging the titlebar.
- Resize the graph by clicking and dragging the resize widget at the bottom-right of a graph.
Deleting a graph. To delete a graph, click the "X" button in the top-right of the graph window. You can also scribble-delete a graph.
Table of Values. Click the "Table" button to view a table of values for the expressions in a graph. Click on the top-left cell to change the min/max/step values for the table.
Graph menu. Click a graph's button for a list of additional graph commands including reset view, edit/import data points, toggle features (intersections, intercepts, local min/max), and axis style (e.g., radian tick marks).
Import/Edit data points. You can add or edit a graph's data points by clicking the graph's menu and then "Edit Data". Next, type or paste coordinate pairs into the pop-up window that appears. For example, paste data from an Excel spreadsheet you access on your iPad. Data must be in 2-column format and represent x, y coordinate pairs. To edit data later, select the "Edit Data" menu item and you can edit the data points you entered previously.
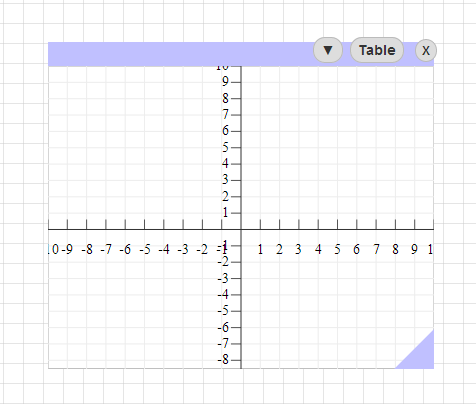
Advanced: empty graph gesture. Draw a large pair of axes ("+"-like shape) to create an empty graph at a particular location and size.
Advanced: other types of graphs. In addition to the cartesian graphs described above, which are defined in terms of \(x\) and \(y\), you can plot polar functions by using the variables \(r\) and \(\theta\), and single points by writing them as coordinate pairs (eg \((0, b)\)). Parametric graphs may be made in one of a few ways: You can write \(x\) and \(y\) as separate equations in terms of \(t\) (eg, \(y=sin(t)\) and \(x=cos(t)\)) or as separate functions of \(t\) (eg, \(y(t)=sin(t)\) and \(x(t)=cos(t)\)) and draw a single graphing gesture that passes through both equations (currently this only works if the equations are hand-written, not typed). Alternatively, you can write a single ordered pair with the variable \(t\) in it (eg \((cos(t), sin(t))\) or \((x(t), y(t))\)) and graph that (which works for both typed and handwritten math).
Advanced: control of domain. You can control what range the independent variable, generally \(t\), \(\theta\), \(r\), \(x\), or \(y\), is evaluated over by writing an expression using interval notation such as \(t\in[0,2\pi]\) or \(x\in[-10,10k]\) somewhere on the page.
Sliders
Sliders provide a way to quickly vary the value of a parameter. One useful application of sliders is varying one or more parameters of a graphed math expression and observing how the plot responds.
To create a slider in FluidMath, first write a simple assignment of the form "variable = value", such as "b = 3". Next, to create a slider for "b" draw the "slider gesture". The slider gesture is a stroke that starts on the equals sign, extends directly down, and ends outside the expression's yellow box. The expression "b=3" will be replaced with a slider.
The slider gesture is a stroke that starts on an equal sign, extends directly downwards, and ends outside an expression's yellow bounding box. The slider gesture only applies to expressions of the form "variable = value".
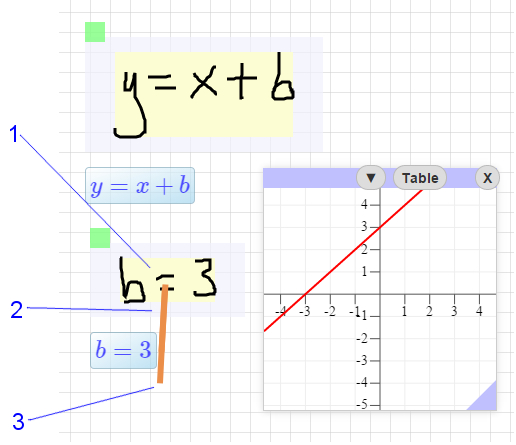
1) Start slider gesture inside yellow box on the equal symbol. 2) Draw slider gesture straight down from equal sign. 3) End slider gesture outside yellow box below math expression.
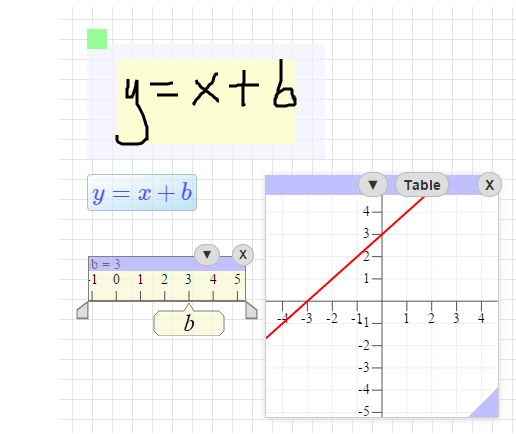
A slider widget replaces the math handwritten "b=3" math expression.
Try it! Press the "Clear" button and write "b=3" then draw the slider gesture to create a slider for "b".
To vary the value, click on the tear-drop-shaped widget handle labeled with the variable name and drag it left or right.
To change the minimum and maximum of the slider's range, click and drag the axis background horizontally to offset the range. Click and drag the background vertically to scale the range.
Slider values can be continuous or constrained to discrete or values at tick marks. Click the slider's button and then the "Values" option to review the current mode (a checkmark will appear next to it) or to set the current mode.
To move the slider, click on the titlebar and drag it to the desired position.
To delete the slider, click on the "X" button in the top-right of the slider's window.
Animation
Bring your sketches to life by applying math expressions to sketches!
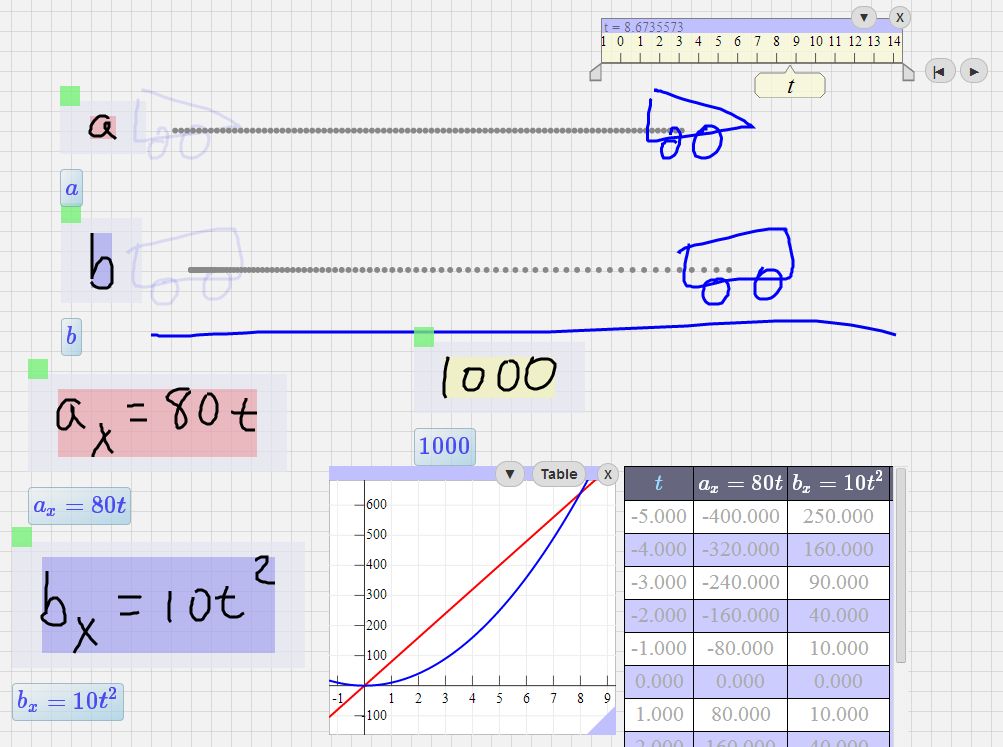
Example math sketch. Consider the following example problem:
Car a is moving with constant velocity and car b is moving with
constant accelleration. At what time t will car b
catch up to car a?
To setup the problem, two cars were drawn, labeled, and the math equations describing the motion
of the two cars was written on the page. A slider for t was created and
then you can either run the animation or manually drag the t slider widget to explore
the state of the animation for various values of t. Graphical and numeric representations
of the equations can further help investigate this problem.
Open a live version of the above car animation page.
How to create your own animation:
- Go to "Options.." in the top menu and select "Math Sketching".
- Choose the "Draw" pen and draw an object and ground line (if you want to set the scale for your sketch).
- Switch back to the "Math" pen and label each object by drawing a variable name near it (e.g., a).
- (Optional) Write a number near the ground line to specify how long the line is.
- Write an equation where the left-hand side is the variable and a subscript x or y. E.g., ax = 80t and the label and equation should be shaded with the same color. This indicates the math expression has been associated with the labeled sketch.
- Create a slider for "t". Change the view so "0" is at left side of the slider range and the maximum value you want for t is at the right of the slider range.
- Click the "play" (▶) button to run the animation.
- Drag the slider for "t" to vary t manually.
- To change the math or page after running the animation, first tap anywhere on the background to return to editing mode.
Sharing
Sharing "live" documents. If you have a FluidMath account and are logged in then you can share a document with others easily. First, create a document and then save it by clicking on "Save" in the toolbar. Next select "Share" and click the (Copy to clipboard) "URL" button in the resulting dialog. You can then paste the URL and send it to others (e.g., by email or in a document). Need an account? Click here.
iPad users. You can send your FluidMath page to others as bitmap images. Capture your FluidMath screen by pressing-and-holding the iPad home button and then pressing the suspend button. An image of the screen will be added to your Photos. You can then email or share the image as you would any photo.
Mac OS users. You can capture the entire screen by pressing Command-Shift-3. Or, you can capture a specific part of the screen by pressing Command-Shift-4 and dragging a rectangle to surroung the area you want to capture.
Windows users. Snipping Tool is available on Windows 7. Pressing Alt-PrtScn will copy the active window to your clipboard. Ctrl-PrtScn will capture the entire screen to your clipboard.
Additional options for sharing FluidMath content are available in the Share dialog.
Highlight Equivalence
Turn on this feature using the "Equiv" toolbar button (or item in the "..." menu at the top if there's not enough space in the toolbar) to set the background color of equivalent expressions or equations to be the same color.
Examples:
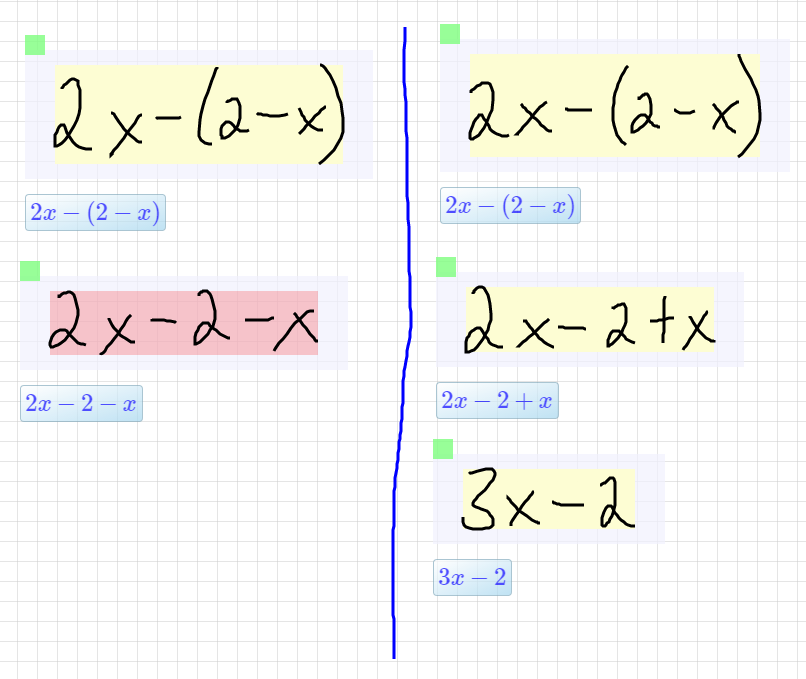 Simplifying an expression.
On the left side of the image, the student first tries to simplify, but makes a mistake in the first
step and the student gets feedback because the expressions are different colors. On
the right side of the image the student corrects the mistake and continues. The student gets feedback that
no mistake has been made because all three expressions have the same background color.
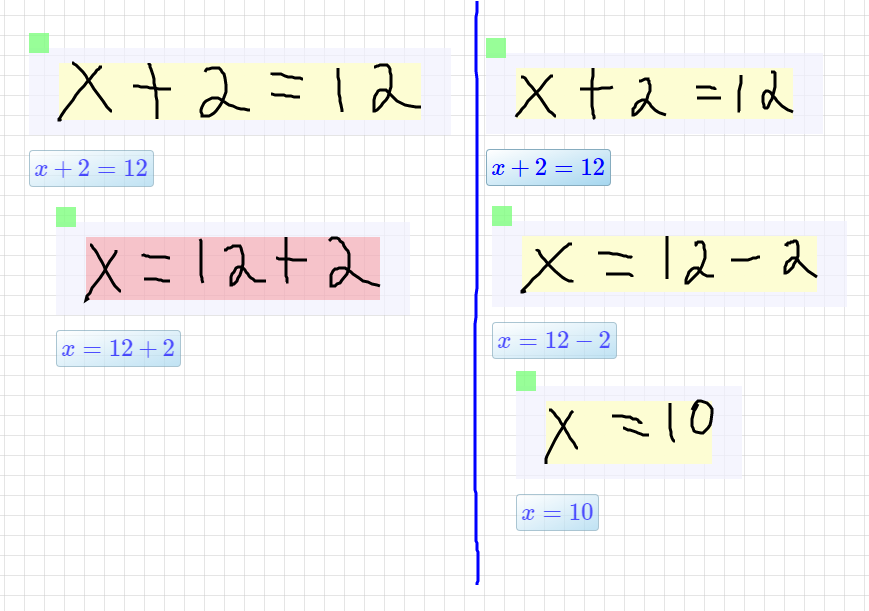 Solving an equation.
(For least confusing results, turn Automatic Context off when highlighting equivalence of equations (as opposed to expressions, with no equals sign). See the dicussion just below in the Automatic Context section.)
On the left side of the image the student tries to solve the equation, but makes a mistake in the
first step and the student gets feedback because the expressions are different colors.
On the right side of the image the student corrects the mistake and continues. The student gets feedback
that no mistake has been made because all three equations have the same background color.
Automatic Context
With this option set, all variable settings are used when highlighting equivalences. With the option not set, only variable settings in parentheses are used. For instance, \(a+b\) and \(a-b\) are not normally equivalent, but they are if \(b=0\) is also written on the page and automatic context is turned on. Even if automatic context is turned off, writing \((b=0)\) on the page will make them equivalent.
Example:
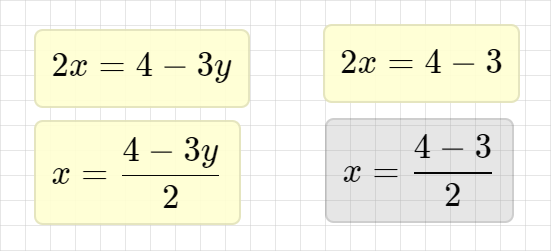
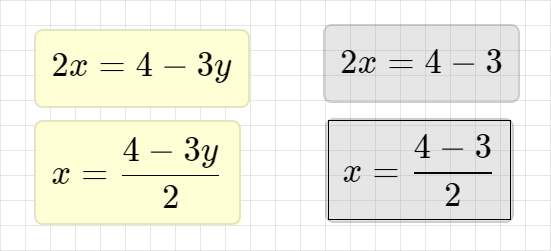
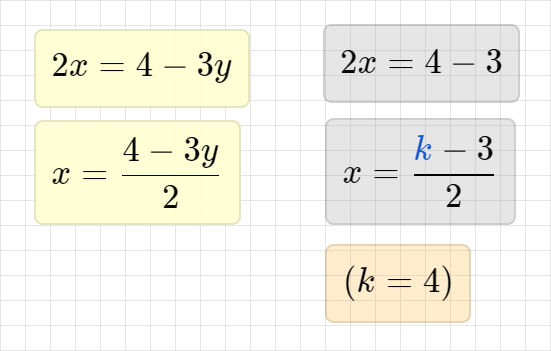
In the first image, highlight equivalence and automatic context are both turned on, and the user has written two derivations on the same page. Because each derivation has a final line of the form \(x=\cdots\), there are multiple apparent definitions of \(x\) on the page. The system tries to guess which value the user wants, but in this case the user doesn't want anything substituted, and the highlighting appears wrong. In the second image, automatic context has been turned off, and the highlighting is now as expected. In the final image, the user is still able to get a variable substituted by writing the definition \(k=4\) in parentheses. (Values defined by sliders are also always substituted.)
Advanced
This section describes several topics you may want to learn about after you have mastered the previous topics.
"Shrinking Ink". You may find you run out of space after adding content to a page. You can shrink the size of math expressions by converting them from hand-drawn math expressions to more compact typeset ones.
How to shrink ink. An expression must be recognized (i.e., it must have blue typeset showing its recognition below it) before you can shrink it. To shrink an expression click on the blue typeset button at the lower-left of a handwritten math expression. Once converted, you can click-and-drag to move the expression on the page or tap it to edit the math strokes in a pop-up overlay. Scribble over the typeset math expression to erase it. You can also switch to "Math Type" mode, click the expression, and edit it as typeset text.
Shortcut. Click on a letter symbol to create a slider for that symbol.
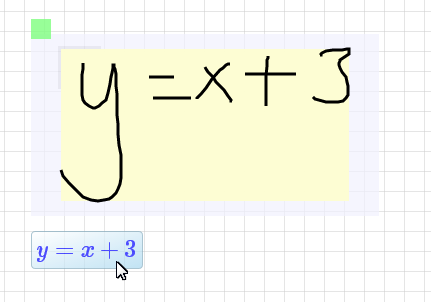
(Above) Click on blue typeset to convert handwritten math to a more compact form (see below).
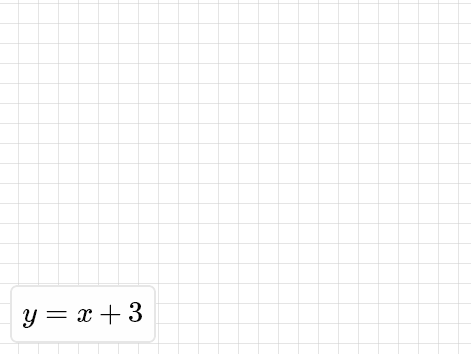
Drag-and-drop the typeset math expression widget to move it or add it to a graph. Scribble over typeset math widget to erase it.
Empty graph gesture. Draw a large "+" on an empty part of the page to create an empty graph.
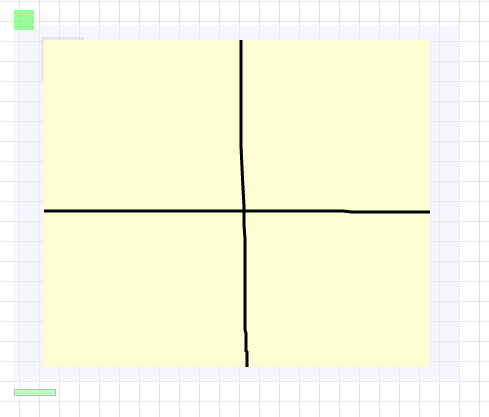
Draw a large "+" on an empty part of the page (see above) to create an empty graph (see below).
Typed math shortcuts. When typing math, you can enter mixed numbers conveniently (assuming mixed numbers are turned on in the "..." menu), by typing the integer part, then control+space, then the fractional part (numerator, /, then denominator). Alternatively, you can type the integer part, then control+/ to insert a fraction, and then fill in the fraction. You can also use the following shortcut keys (among others) in typed math:
| Key | Action |
|---|---|
| control+m | insert a 2×2 matrix |
| alt+/ | insert a literal "/" character (for "inline division") |
| alt+shift+/ | insert a division symbol ÷ |
| alt+8 | insert a multiplication sign × |
| control+5 | switch between super- and subscripts (eg for integral limits) |
| control+return or control+; | add row to matrix (below) |
| control+shift+; | add row to matrix (above) |
| control+, | add column to matrix (on right) |
| control+shift+, | add column to matrix (on left) |
(On a Macintosh, use ⌘ instead of control for all of the above.)
Speech output. When editing a typed math expression, you can press control+alt+⇩ to cause the computer to read the expression to you. This also works with "shrunk ink" if you switch into Math Write mode and click the typeset "shrunk" box.
Assumptions. When evaluating and testing expression equivalence, FluidMath can make assumptions about the values that the variables you use may have in order to simplify your use of the system. Variables can be assumed to be real, nonnegative (greater than or equal to zero), or unconstrained (meaning they can be any complex number). For instance, the expression \(\sqrt{x^2}\) is equivalent to \(x\) if \(x\) is nonnegative (eg \(\sqrt{4^2}=4\)), to \(|x|\) if \(x\) is real (eg \(\sqrt{(-4)^2} = |-4| \ne -4\)), and can't be simplified if \(x\) can be any complex number (eg \(\sqrt{(3+4i)^2}=3+4i\ne|3+4i|=5\)).
Additionally, variables can be assumed to be nonnegative if they are squared. For instance, the equations \(100=c^2\), \(\sqrt{100}=\sqrt{c^2}\), and \(c=10\) are all considered not equivalent to each other if variables are unconstrained, but all equivalent to each other if variables are assumed to be "nonnegative if they are squared".
Note for equivalence checking: the equations \(a^2=-4\) and \(a^2=-9\) (for instance) are considered equivalent if \(a\) is assumed to be real (or nonnegative, which implies real), as equivalence checking of equations tests whether the set of solutions is the same for each equation. In this case, there are no real solutions, so the solution set for both equations is the same, empty. Similarly, if \(m\) is assumed to be positive, \(-8+m=-56\) and \(-8+8+m=-56\) are considered equivalent because neither has any positive solutions.
To set the default assumptions for all variables on the current page, look in the "..." menu under "Assume variables to be:". You may also override these assumptions per-variable by writing the mathematical form of the equivalent condition in parentheses. For instance, to make \(x\) be assumed to be positive, you would write \((x>0)\) somewhere on the page. You can write any relation between the variable and 0 in parentheses (eg \((x<0)\) to assume \(x\) is negative, or \((0\ne x)\) to assume \(x\) is nonzero) or you can write a set membership expression such as \((x\in\mathbb{R})\) to assume \(x\) is real. (\(\mathbb{C}\), \(\mathbb{N}\), \(\mathbb{Z}\), and \(\mathbb{Q}\) are also supported. "Unconstrained" in the menu options is equivalent to writing that the variable is in \(\mathbb{C}\).) Due to a bug, writing set membership expressions as assumptions currently only works if the set membership expression is handwritten rather than typed.
You may set the default assumptions for new documents you create by going to your profile (in the "hamburger" \(\equiv\) menu at the left of the toolbar, select "⟨your name⟩ Profile"), then clicking the "Preferences" link under "Manage Settings".
Assumptions are not necessarily returned in the results of solutions; they're simply assumed. For instance, if you have \(-2\le x<4\) on the page, have variables assumed to be positive, and solve for \(x\), the result will be \(x<4\), not \(0<x<4\).
Congratulations!!!
Congratulations! You have finished the FluidMath tutorial. You are ready to start using FluidMath. We hope that you enjoy it!
If you have any comments or questions about this tutorial or FluidMath itself, please contact us.
Additional Resources
Related Products
Fluidity Software also provides a stand-alone version of FluidMath.
- FluidMath (for Microsoft Windows)
- A full-featured version of FluidMath designed for teachers and written for Microsoft Windows.
- See FluidMath in action on the FluidMath YouTube Channel
- FluidMath for Microsoft Windows
- FluidMath for Interactive Whiteboards
FluidMath Patents
FluidMath’s technology is patented: US 9,576,495; US 9,691,294; US 9,773,428; US 10,431,110; US 11,282,410.

